We always hear experts saying that when interest rate increases, bond prices fall. More directly, there is an inverse relationship between bond prices and interest rates. Why is that so?
Let us consider using zero coupon bonds. A zero coupon bond, as defined by Investopedia, is a debt security that doesn't pay interest (a coupon) but is traded at a deep discount, rendering profit at maturity when the bond is redeemed for its full face value.
So now assuming a customer buys a zero coupon bond for $1000. At maturity 1 year later, he gets back $1050. From here, we can see that the interest rate paid by the bank to the customer is (1050-1000)/1000 x 100% = 5%.
If the interest rate provided else where apart from buying these bonds are lower, consumers will want to stick with the bonds as they pay higher interest.
If interest rate elsewhere increases to more than 5%, then consumers will want to sell their bonds at maturity, get the cash and place it somewhere else where it can earn higher interest i.e. demand for bond reduces. When the bonds are sold, supply of bonds increases and thus the price of bonds will drop using the basic demand and supply model.
Conversely, when the interest rate offered is lower than the interest rate provided by buying bonds, or that interest rate has dropped, then consumers will demand and buy bonds as it offers a higher interest. When purchase of bond occurs, the increased demand will push the price of the bonds up.
From here, we can evidently see that a inverse relationship exists between interest rate and bond prices.
Tuesday 31 December 2013
Wednesday 4 December 2013
Moral Hazard and Adverse Selection
A while back, someone asked me how does an individual differentiate between moral hazard and adverse selection. I thought about it for a while before answering not because I didn't know what was the meaning but because I was thinking of the best way to explain to someone who does not have any economics background.
One similarity between them: They are both market failure conditions
As it is a term that is commonly used by economists, I was surprisingly shocked by how could it even be possible that someone does not know the difference when it is so distinct. Anyway, we can't always assume that everyone knows the same amount of information =). Ask me something about literature and I am sure would not know the answer either although it may be common sense to the literature major student. At the end of the day, I managed to clarify those terms to him, I hope.
By the simplest definition of moral hazard, it can be understood as the change of an individual's behaviour solely due to the contractual agreement between the 2 parties. In layman terms, your behaviour towards an issue is affected due to an agreement that you have with another party. This change of behaviour will lead to a deadweight loss (DWL) i.e. a loss in welfare to society.
Let me explain in more details using the example for moral hazard first before showing you graphically why is it a loss in welfare to society. I will be using the example of healthcare since I just finished a module on Health Economics. Assuming, you have to spend $100 bucks on healthcare expenditure every time you visit a doctor due to the prescription drugs. However, due to your budget constraint, you can only afford 5 visits per month. Now if an insurance policy is offered to you for a very low premium and at the same time pays 50% of your healthcare expenditure for every visit to the doctor. Would your behaviour change if you were to take up the policy?
Almost every rational consumer would either increase the number of visits to the clinic if required or even ask for a more expensive version of the prescription drug if available as the out of pocket expenditure by the individual is reduced. This in essence is moral hazard. I'm sure there are many other examples that you can think of once you grasp the concept.
Graphically, it can be shown as such:


Note: I took it directly from my lecture notes as it would save me time trying to draw the graph. Nonetheless, the main point is made.
Now, with respect to DWL;
As seen in the graphical representation using a simple demand and supply diagram, we can see from the first diagram that the original total healthcare expenditure is blue in colour whereas, the additional expenditure due to insurance coverage is pink in colour.
From the second diagram, we can see that the additional value gained from the individual is the lighter blue shade under the original demand curve and the yellow triangle refers to the DWL.
Lastly, in the third diagram, adding in the supply curve and using the graph to represent the whole economy, we can see the that total yellow region has increased.
Why does DWL cause a loss in welfare to society? In layman terms, it is because, these resources could be better utilised elsewhere.
Moving on to adverse selection:
Again, let us start off with the definition. Adverse selection can be understood as a market process where sellers have information that buyers don't (or vice versa), or asymmetric information (access to different information) about some aspect of product quality or service, resulting in the "bad" products or services to be more likely to be selected i.e. Both parties have different level of knowledge of the product or services and thus one side is always at an advantage.
Let me explain this using the insurance market once again. In Bukina Faso, Africa, formal insurance for the farmers in the rural farms seldom exist for a couple of reasons such as high fixed and variable cost of operations. Apart from that, the insurance company may not be able to guard against the issue of moral hazard if they were to provide insurance for the farmer. i.e. How would the insurance company know that farmers will continue to take care of their farm and not slacken off in order to receive the pay out by the insurance company when they do not meet their crop yield requirement?
Above that, insurance companies and their agents, normally from the urban cities itself, may not know the conditions of the farms as well as the farmers themselves. What if the farmers were to choose a piece of land that is less fertile or more prone to diseases to insure? It will almost be certain that insurance companies will end up losing money should they insure these land. On the other hand, how can the farmers know that they can trust the insurance companies since they are the ones that know a lot more about the policies as compared to the farmers themselves. This in essence is adverse selection. Often, the presence of asymmetric information would result in adverse selection causing in some markets to fail to exist in the very first place!
Hope this post clarifies the differences between moral hazard and adverse selection! =)
Tuesday 3 December 2013
Applied Econometrics : RAMSEY RESET TEST
The RAMSEY RESET TEST is carried out when the tester feels that the functional form may not be right. For instance, a general linear regression will take the form as shown below:
However, the tester may feel that the functional form should take the form of :


Thursday 16 May 2013
What are the characteristics of the indifference curve (cobb douglas specific)
These are the few characteristics of the cobb dougles indifference curve
1. It cannot be thick
2. Indifferent curve cannot cross or intersect each other
3. It is convex
4. It is bowed towards the origin
Before i go on explaining and illustrating it graphically, lets think about what concept of monotonicity /convexity / transitivity that it violates if any of the above 4 conditions occurs. =)
Graphically:
1. Indifference curve cannot be thick
(Violates monotonicity)

2. Indifferent cannot intersect each other
(Violate monotonicity and Transitvity)
 Source : Pearson
3. It is not concave
(violates monotonicity and convexity)

4. It is bowed towards the origin
(Reference marginal rate of substitution and follow on to why must IC be convex)
1. It cannot be thick
2. Indifferent curve cannot cross or intersect each other
3. It is convex
4. It is bowed towards the origin
Before i go on explaining and illustrating it graphically, lets think about what concept of monotonicity /convexity / transitivity that it violates if any of the above 4 conditions occurs. =)
Graphically:
1. Indifference curve cannot be thick
(Violates monotonicity)

2. Indifferent cannot intersect each other
(Violate monotonicity and Transitvity)

3. It is not concave
(violates monotonicity and convexity)

4. It is bowed towards the origin
(Reference marginal rate of substitution and follow on to why must IC be convex)
What are convex preferences?
Convex preferences:


Where alpha is a positive constant. X and Y are indifferent.
Thursday 2 May 2013
What are monotonic preferences?
In this post, I will be focusing on monotonic preferences. Notes that utilisation of graphs will be used here for better clarifications.
In order to better understand the shapes for these graphs. We need to first define the indifference curve (IC).
What are IC? IC are graphs showing different bundles of goods I.e different combinations of good X and good Y in which the consumer has the same preferences as long as it lies on the same curve. In the IC shown below for the different utility functions, any combinations of goods that is obtained by the green line creates the same level utility for the consumer. This means to say that the consumer will be indifferent between the different bundles of goods i.e i like Bundle A of goods as much as Bundle B as long as it is on the same IC.


In economics, we can understand monotonicity in simple terms which simply means "the more the merrier". When an individual has monotonic preferences, it means that he prefers more of a quantity of goods as compared to less.
See graphical illustration below:


1. Monotone or weak monotonic preference
2. Strictly monotone or strong monotonic preference
Although written in different way, strictly monotone preferences for example, is exactly the same as strong monotonic preferences, same for point 1.
Let me better clarify the terms.
1. When preferences are monotone / weak monotonic preference , the consumer prefers:
If bundle A = (2,3) and bundle B = (4,5), we can represent it mathematically as:
This implies that: 4 is preferred to 2 (4>2) and 5 is preferred to 3 (5>3). Generically , it can be represented as if X = (X1, X2) and Y = (Y1, Y2), X>>Y => X1>Y1 and X2>Y2 => X>Y

2. Strictly monotone or strong monotonic preferences
When preferences are strictly monotone or having strong monotonic preference , the consumer prefers:
For instance, let us use the case of a perfect subsitutes (PS)

In the above graph illustrating the utility function that represents PS, if a imaginery L can be drawn from the original bundle of A that the consumer chooses, we can evidently see that the consumer will prefer bundle B eventhough the amount of Good Y in bundle B remains the same and only the amount of X has been increased. Therefore, we can see that it satisfies the criteria of being strictly monotone.
The same effect can be seen for cobb douglas utility functions.
In order to better understand the shapes for these graphs. We need to first define the indifference curve (IC).
What are IC? IC are graphs showing different bundles of goods I.e different combinations of good X and good Y in which the consumer has the same preferences as long as it lies on the same curve. In the IC shown below for the different utility functions, any combinations of goods that is obtained by the green line creates the same level utility for the consumer. This means to say that the consumer will be indifferent between the different bundles of goods i.e i like Bundle A of goods as much as Bundle B as long as it is on the same IC.


In economics, we can understand monotonicity in simple terms which simply means "the more the merrier". When an individual has monotonic preferences, it means that he prefers more of a quantity of goods as compared to less.
See graphical illustration below:


We often subdivide this monotonic preferences into 2 categories.
1. Monotone or weak monotonic preference
2. Strictly monotone or strong monotonic preference
Although written in different way, strictly monotone preferences for example, is exactly the same as strong monotonic preferences, same for point 1.
Let me better clarify the terms.
1. When preferences are monotone / weak monotonic preference , the consumer prefers:
More of both goods.
If bundle A = (2,3) and bundle B = (4,5), we can represent it mathematically as:
B>>A
This implies that: 4 is preferred to 2 (4>2) and 5 is preferred to 3 (5>3). Generically , it can be represented as if X = (X1, X2) and Y = (Y1, Y2), X>>Y => X1>Y1 and X2>Y2 => X>Y
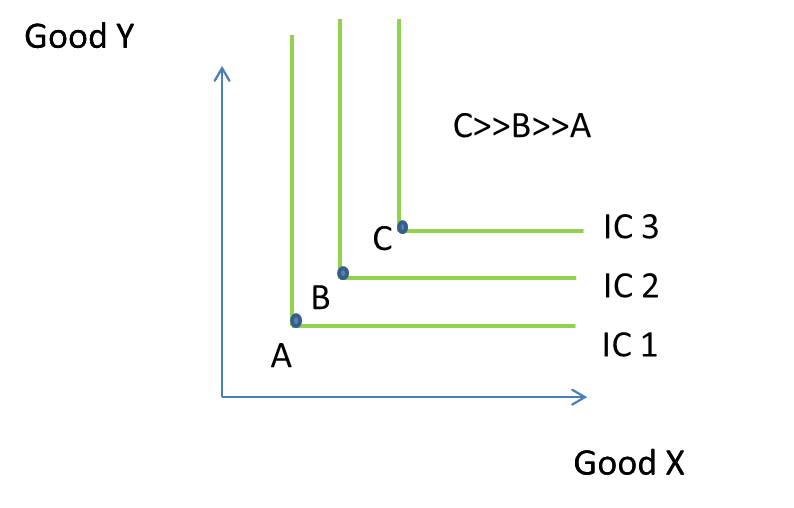
For instance, let us look at the case of a perfect complement:

A perfect complement (PC) utility gives preferences that are monotone but not strict monotone. Why so?
We can show this through proof by contradiction: Assuming it is strictly monotone, then x(whether it is on the x or y axis), which is on the IC will be preferred to y. However, what we saw earlier was that consumers will be indifferent between any bundles on the same IC. From here, we can see that a PC utility function results in preferences that are monotone (they will prefer the point x that is not on the IC) but not strictly monotone.
In general, IC that gives will flat region either horizontal or vertically will be monotone but not strictly monotone.
Mathematically, it can be written as:
x≥y but x ≠ y => x > y
When preferences are strictly monotone or having strong monotonic preference , the consumer prefers:
More of one good but no less of the other.
For instance, let us use the case of a perfect subsitutes (PS)

In the above graph illustrating the utility function that represents PS, if a imaginery L can be drawn from the original bundle of A that the consumer chooses, we can evidently see that the consumer will prefer bundle B eventhough the amount of Good Y in bundle B remains the same and only the amount of X has been increased. Therefore, we can see that it satisfies the criteria of being strictly monotone.
The same effect can be seen for cobb douglas utility functions.
Wednesday 24 April 2013
What are preferences and utilities?
Preferences of an individual can be understood as a ranking of alternatives depending on the level of happiness and utility that can be brought to the individual. In order for ranking of preferences, the individual needs to be rational. i.e He can't say i don't know, although he can say for instance, i have the same preference for Apples and Oranges. As such, economists need 2 main conditions:
Completeness and Transitivity
Completeness:
A ranking can be complete only if all the possible combinations of bundles of good can be ranked. For instance, assuming for an individual, there exists a basket of fruit of 3 apples (A) and 3 oranges (O), totalling 6 fruits. This is the bundle of goods that the individual possesses. With his bundle of goods, he will be able to rank all the different combinations of apples and oranges. For instance, he can have a complete ranking preference by choosing the combination of 0A and 3O or 1A and 3O or 2A and 2O etc and the list goes on. As long as all the possible combinations of bundles of goods are accounted for, his ranking is complete.
Transitivity:
This concept requires rational behavior. For instance, you have 3 options of goods: Sandwiches, Hotdogs and Burgers and you are asked by your mum to choose the preferences for what to have for lunch. After a moment, you decided that you prefer sandwiches to Hotdog and hotdogs to burgers. From here, if you are a rational person, you will be implying that you prefer Sandwiches to Burgers since:
Sandwich > Hotdogs > Burgers
=> Sandwich > Burgers
The > here refers to preferences and not the usual more or less function. This concept can be known as transitivity. I.e. your preferences are transitive. However, if your decisions are not rational, you may choose burgers over sandwich which does not really make sense.
=> Burger > Sandwich
This is not a rational decsions as based on your ranking above in the decision matrix since you have ranked sandwiches as the top food that you want to consume and burgers as the last.
Once ranking of preferences can be complete and transitive : Your preferences will be rational.
Utilities can be understood as numbers that will help determine the level of happiness of the individual to aid in his ranking of preferences. In the process of preferences ranking, an individual will rank the bundle of good (X,Y) that gives the highest utility above the rest. However, it is important to note that a utility function that generates a number that has twice the amt of another bundle of good does not mean that the particular bundle is twice preferred or twice as good. The numbers generated from these functions serve as a guide for placement of ranking. Allow me to elaborate with an example:
Using a very basic utility function : U(X,Y) = X+Y
If X = 1 and Y = 1 => This will give a utility of 2
If X= 2 and Y = 2 => This will give a utility of 4
Taking that utility functions takes only positive transformation, certainly a utility of 4 gives higher satisfaction or happiness as compared to a utility of 2 (You will always prefer more to less unless you have reached a satiation point, which will be elaborated in other posts). However, this does not mean that 2+2 is twice as good as 1+1.
For example: if X is apple and Y is orange, have a total of 4 fruits in your basket does not means that you are twice as satisfied or twice as happy. Why? We of think of it simply as happiness and satisfaction are intangible materials that can't be quantified. However, we can quantify that having twice the amount of apple and orange will make you more happy as you have more fruits to eat, assuming that it has not reached your satiation point.
By the way, the utility function above refers to one of perfect subsitutes which will be elaborated in future posts. More examples will be posted for different utility functions in future posts
Subscribe to:
Posts (Atom)